

This graph shows the frequency of the bully, bullyvictim and the victim |
Graphs and statistics are unbelievable
|

This graph shows the amount og people involved in certain wrong this including middle school, high school and primary school |

|
|

This graph shows the statistics of mean
|
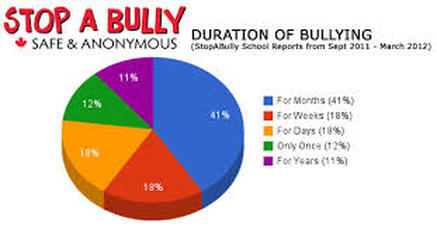
this pie chart shows the duration of bullying (how long it lasts)
|
